|
A recent Narwhal story is called In Canada's coldest city, homes were built for warmth. Now they're way, way too hot. It alleges that the number of very hot days in Winnipeg are increasing. A troubling statement from the CEO of CanAge (a national seniors advocacy) is included in the Narwhal article: “Older people are saying they’ve never been so hot, and there’s nowhere to go to cool down,” she says. “It didn’t used to get this hot, but with climate change being what it is we’re getting heat that doesn’t go away.” The reporter provides a graph showing the number of 30+ C days from 1976 onward in support of the following statement: Very hot days — with temperatures over 30 C – used to be more of a rarity, but the number of those days Winnipeg sees each summer is trending upwards. Experts say it will only get more extreme if carbon pollution isn't curbed. The reporter’s stats purport that the number of very hot days has been trending up from 13 to 14 a year over the last 47 years. However, if you look at the Environment Canada temperature records for the same period at Winnipeg International Airport, the number is actually trending downward from 14 to 13. Using either data set, there is little change in the last 47 years. Environment Canada data goes back 85 years: 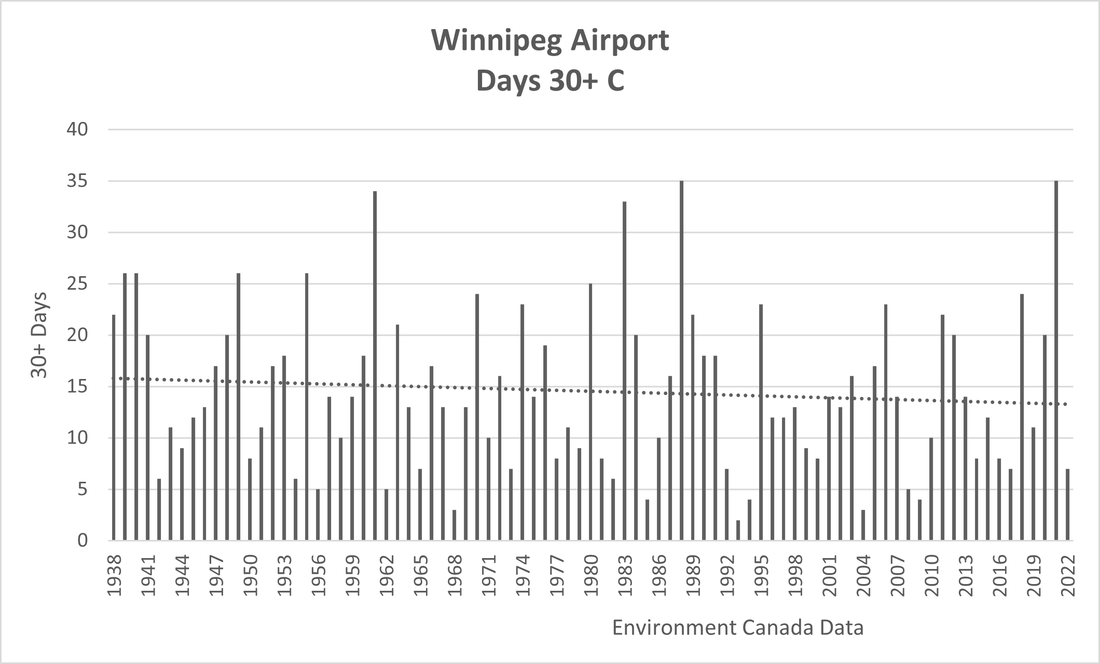 This demonstrates a downward trend from 16 to 13 very hot days since 1938 … but how can this be if the Narwhal is using credible data? Their numbers come from the Climate Atlas Of Canada who describe themselves:
The Climate Atlas of Canada combines climate science, mapping, and storytelling together with Indigenous Knowledges and community-based research and video to inspire awareness and action. The storytelling they publish is developed from calculations by the Pacific Climate Impacts Consortium at the University of Victoria. Derived temperatures from two dozen global computer models, using medium-to-high CO2 emission pathways, are then downscaled to 10 square kilometre areas such as Winnipeg. They explain: Data from each climate model is downscaled to a finer resolution using one or more statistical methods and a gridded “target” observation-based dataset, which constitutes a reconstruction of the actual historical climate over Canada. Note that for the historical period used to calibrate the downscaling methods (1950-2005 for CMIP5, 1950-2014 for CMIP6), statistical properties of the downscaled results will, by design, tend to match those of the gridded observational dataset. The day-by-day, month-by-month, year-by-year, etc. sequencing of values, however, will not correspond to observations, since climate models solve a “boundary value problem” and are not constrained to reproduce the timing of natural climate variability (e.g., El Niño-Southern Oscillation) in the observational record. (emphasis added) So if you like your findings cooked (computer models) it’s getting a bit hotter in Winnipeg, but if you like it raw (actual temperature readings) it’s getting a little cooler. Comparing cooked vs raw, the first half of the modeled record (since 1976) adds up to nine 30+ days less than the thermometer record. While the last half is modeled at one 30+ day more than the instrumentation data. This conveniently skews the trend in favour of the reporter’s alarmist position. She embellishes that alarm further, stating that while the long term average is 14 very hot days per year, in the last 5 years it has been averaging 20 hot ones. This is classic cherry-picking. In the first 5 years of airport records starting in 1938 the very hot average was also 20 days. What about the last 10 years (15 days) versus the first 10 years (16 days), or the last 20 years (14 days) versus the first 20 years (16 days). The Narwhal piece is also silent regarding the highest temperature ever recorded in Winnipeg at the airport, which was 40.6 C in 1949. That year is outside the timeframe under their constructed review, and anyways it must just be statistical noise from misleading natural climate variability that the models are not constrained to reproduce.
0 Comments
Leave a Reply. |

Hot Topics
Aboriginal Title Almost Record Heat Atmospheric Rivers Attribution Simulation Carbon Capture Child Litigation Climate Shift Index CO2 Offset Leakage Coastal Flood Risk Democracy Lost Drought Exaggeration Eco-Negativity Eco-Politics ESC Investment Evolution Excess Hydro Expert Hypocrisy Extreme Heatwaves Fake Hype Geo-Engineering Government Bias Heat Waves Hottest Month Ever Hottest Year Ever Housing Crisis Hyperthermia Ice Roads Indigenous Conservation Indoctrination Kelp Farms Landslides Media Bias Mental Illness Misplaced Reconcilliation Misleading Data National Discord Natural Gas Net-Zero Future Outside Play Park Take-Over Political Deception Public Safety Impasse Sea Level Ruse Socialist Agenda Solar Panels Species Not At Risk Statistical Dishonesty Sue Big Oil Temperature Trickery Treaty Infringment Tsunami Refuge Unmarked Burials Unprecedented Drought Urban Heat Island Very Hot Days Warming Causes Cold Water Supply White Dislike Wildfire Wildlife Death Woke Plans Worsening Storms |