|
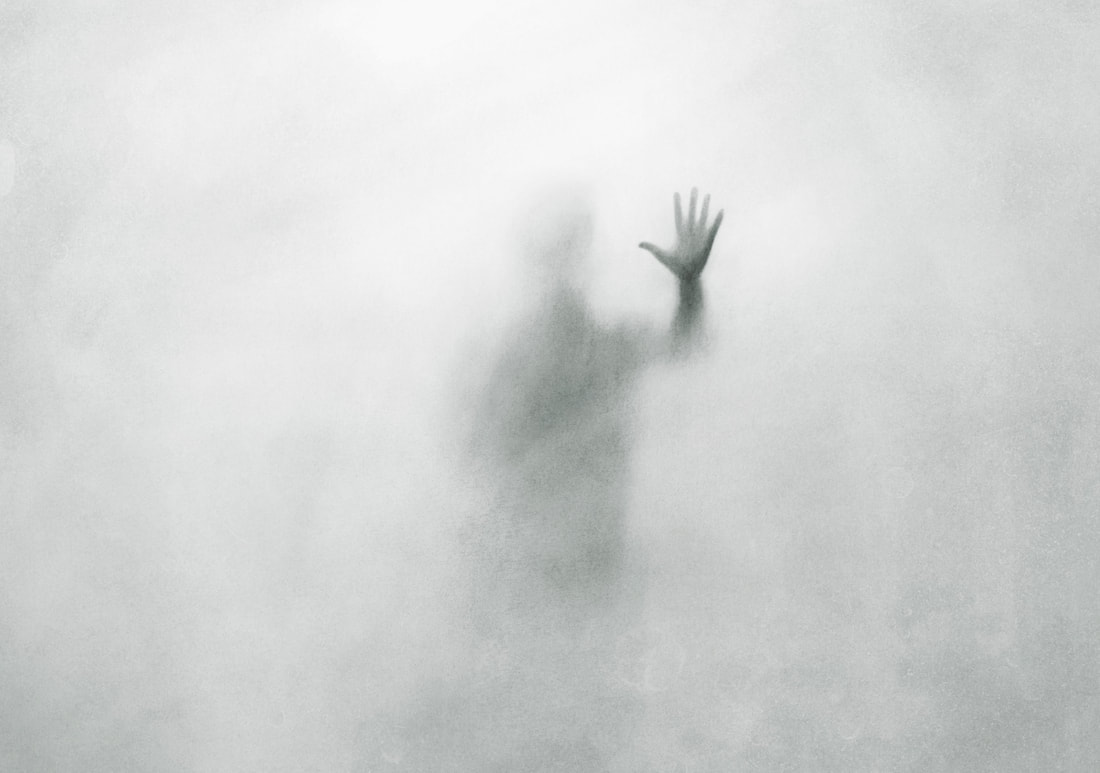
The BC Government’s Drought Information website currently displays the following warning banner: B.C. is experiencing severe drought conditions. Learn more about the Province's response to severe drought, the current drought conditions in your area, and what you can do. If you then click onto the Drought Information Portal you are presented with this photograph:  This succinctly illustrates the disturbing impact of drought in our province, right? Is the abandoned boat washed-up above what used to be the shoreline of Osoyoos Lake? Maybe it lies useless along a dried-up river bank near Cache Creek? No, the picture was actually taken on the island of Crete in the Mediterranean Sea. A vacationing Russian couple snapped these other ones on a different day, as part of their travelogue:
Why is the BC Government trying to influence you with an image taken from a place with an arid climate on the other side of the world? This should be very embarrassing to them. Another (colour-biased) visual on the portal website is 2023 Drought Levels At A Glance: 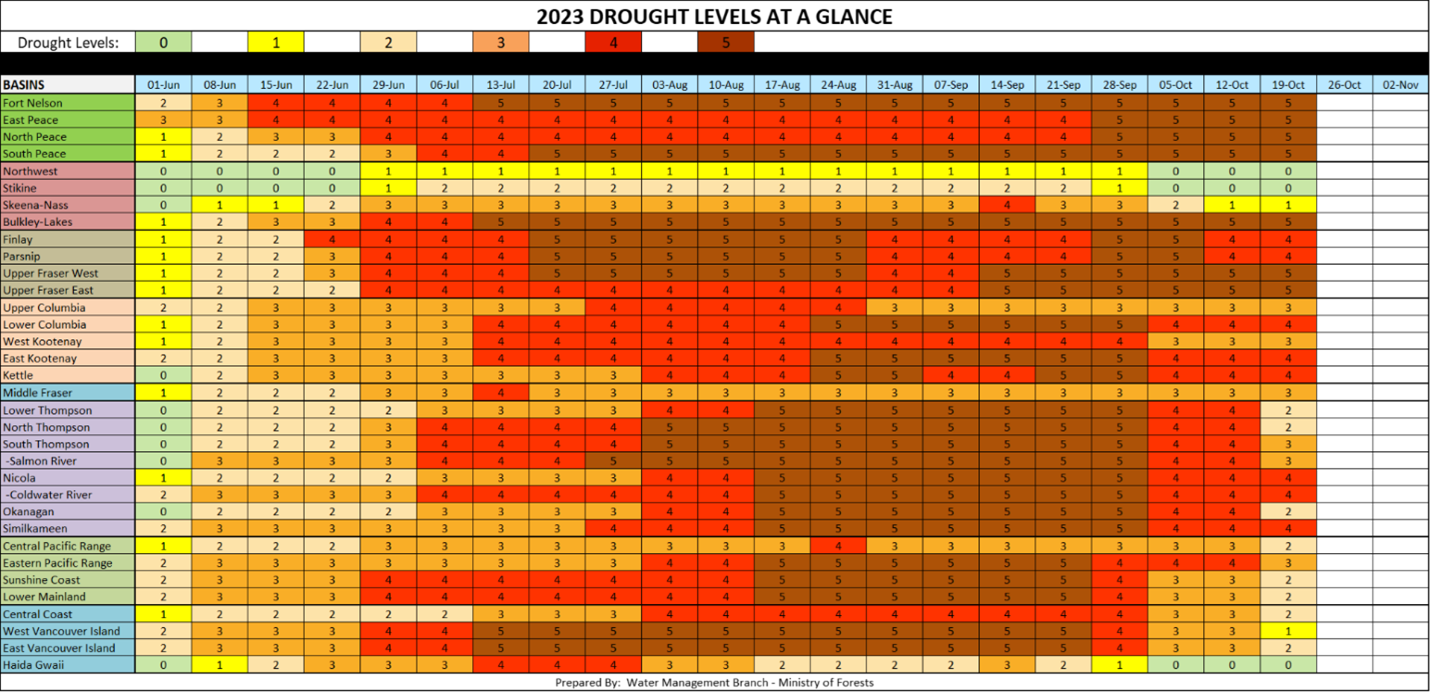 This portrays an over-baked province, with the grid dominated by yellow, orange, red and brown drought level segments. The categories used to establish an expectation for some degree of socio-economic or ecosystem impact are:
1. Rare (yellow) 2. Unlikely (light orange) 3. Possible (dark orange) 4. Likely (red) 5. Almost Certain (brown) The colours chosen are obviously designed to skew the viewer’s impression of how bad the situation really is. Why aren’t Rare and Unlikely depicted as blue and green? Yellow is a better choice for the middle category Possible. According to this graphic, the Vancouver Lower Mainland drought impact level for August and September started at Likely, then went to Almost Certain for 5 weeks, then back to Likely again. This must have been a very significant stretch of high level drought. Yet the Metro Vancouver Reservoir Levels and Water Use volume stayed within the normal range, and if there were any real socio-economic or ecosystem impacts they weren’t readily apparent. The amount of August/September 2023 rain recorded at YVR airport was 67.6 mm, establishing it as the 26th driest August/September in Vancouver over the 87 year record. The driest 3 years for those 2 months were: 2012 – 7.9 mm 1942 – 12.2 mm 1998 – 19.4 mm Hold on that’s not the whole story, didn’t drought conditions begin in the spring and intensify through to the fall? Ok ... and the total rainfall from April 1 to September 30, 2023, at YVR was 223.3 mm which was the 9th driest ½ year stretch. The driest 3 years for the period April 1 – September 30 were: 1938 – 178.3 mm 1973 – 179.7 mm 1967 – 193.1 mm Why are we told that Climate Change droughts are our new normal when we have experienced drier periods in the past? Government does the public a great disservice when it hypes-up false alarm in order to support their agenda. Like the boy who cried ‘wolf’, eventually everyone figures out that they’re being conned and then they may not take the action needed during a real emergency. The little boat marooned on a phony-drought shoreline is a great mascot for the Provincial Government’s climate misinformation team. Hopefully it will remain stranded on the website as a cynical testament to manipulative bureaucracy.
0 Comments
Leave a Reply. |
Hot Topics
Aboriginal Title Almost Record Heat Atmospheric Rivers Attribution Simulation Carbon Capture Child Litigation Climate Shift Index CO2 Offset Leakage Coastal Flood Risk Democracy Lost Drought Exaggeration Eco-Negativity Eco-Politics ESC Investment Evolution Excess Hydro Expert Hypocrisy Extreme Heatwaves Fake Hype Geo-Engineering Government Bias Heat Waves Hottest Month Ever Hottest Year Ever Housing Crisis Hyperthermia Ice Roads Indigenous Conservation Indoctrination Kelp Farms Landslides Media Bias Mental Illness Misplaced Reconcilliation Misleading Data National Discord Natural Gas Net-Zero Future Outside Play Park Take-Over Political Deception Public Safety Impasse Sea Level Ruse Socialist Agenda Solar Panels Species Not At Risk Statistical Dishonesty Sue Big Oil Temperature Trickery Treaty Infringment Tsunami Refuge Unmarked Burials Unprecedented Drought Urban Heat Island Very Hot Days Warming Causes Cold Water Supply White Dislike Wildfire Wildlife Death Woke Plans Worsening Storms |

