|
An August 26, 2024 news piece from Canada’s National Observer is alarmingly titled Extended nightmarish drought strains British Columbia water systems. It claims that, in spite of recent rains, less than 10% of the province has enough water to meet our needs. The article quotes Coree Tull from the B.C. Watershed Security Coalition: “Where we start to get real concerns is in places like Vancouver Island, where you have almost the entire island in stage five drought.” The reporter continues: That creates a nightmarish situation where communities that in the past relied on trucking in water from better-resourced neighbors can no longer call on them because the entire region is struggling with drought, she said. It is hard to believe that any community today would ask its neighbour to send the water trucks … maybe for immediate disaster relief, but not because of gradually dwindling supply. Anyways, it's apparently a nightmarish situation. Is most of Vancouver Island currently experiencing the highest level of drought – Stage 5? Various levels of government want you to think so. On Vancouver Island in the Cowichan Valley Regional District (CVRD), residents are told they are Living The New Normal. CVRD is hoping to achieve that version of water use obedience through misinformation. This CVRD graphic purports just how bad their conditions were on August 26, 2024: 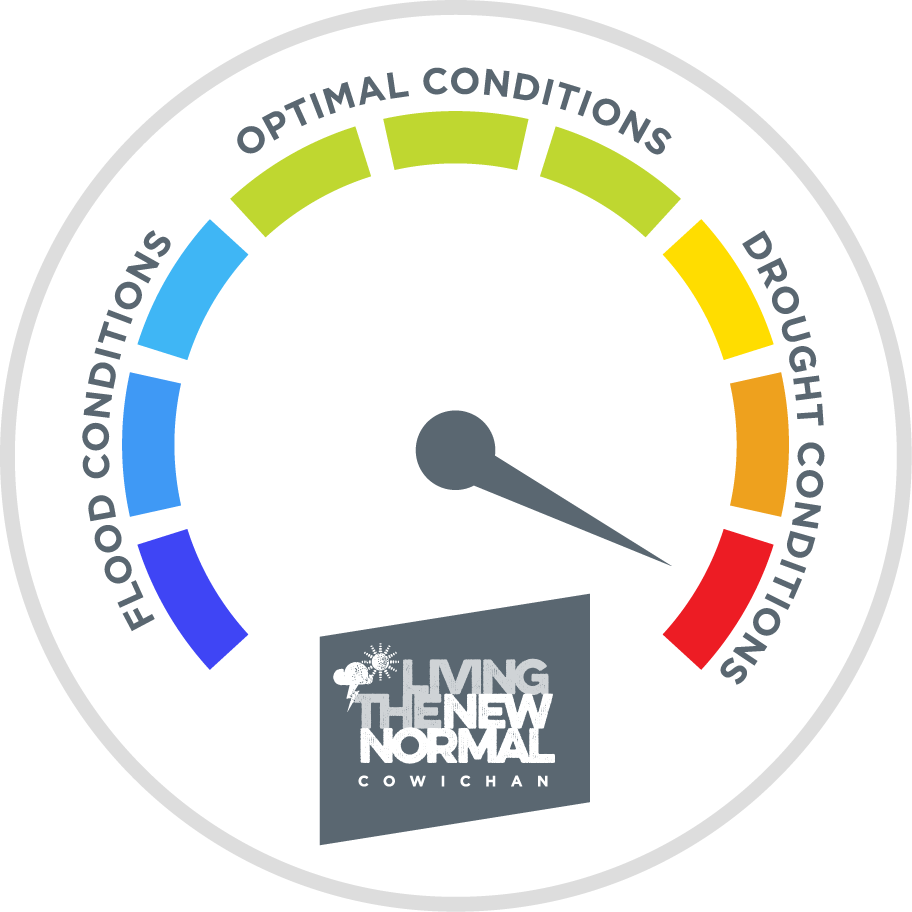 Advising CRVD citizens that they are currently experiencing drought at the highest level, is a deliberate attempt to mislead. Using the CVRD town of Chemainus as an example, because Environment Canada records there go back a long way, the last 10 years of precipitation averaged 1423 mm/yr. By comparison in the 1920s the average was only 986 mm/yr: 1920 1165 mm 2014 1399 mm 1921 1367 mm 2015 1308 mm 1922 775 mm 2016 1676 mm 1923 1028 mm 2017 1419 mm 1924 1089 mm 2018 1562 mm 1925 830 mm 2019 1017 mm 1926 951 mm 2020 1765 mm 1927 1142 mm 2021 1654 mm 1928 876 mm 2022 1188 mm 1929 639 mm 2023 1243 mm So far in 2024, Chemainus received 800 mm from January 1 to August 26. Exactly 100 years ago (1924) the Chemainus precipitation totals from January 1 to August 26 were 467 mm. This must have broken the drought meter back then. Any CVRD 10 year period you choose prior to 1975 will return an average annual precipitation amount less than that of the last 10 years. With respect to water storage the region has various sources including Stocking Lake Reservoir in the hills less than 5 miles from Chemainus. The linked CVRD graph shows that supply levels there always drop to about 65% by the end of summer, and then quickly replenish to 100% through the fall/winter. As of August 22, before another 20 mm fell from then until August 26, Stocking Lake was 80% full. This is the 2nd highest amount of water in the lake at this time of year, in the last 20 years (behind 2022). While there is no real drought on Vancouver Island, there is overuse of available water. The population of Chemainus in the 1920s was about 600, but now it is over 4,000. The same growth is happening in virtually all BC communities, but infrastructure isn’t keeping up. Rather than acknowledging their own apparent lack of planning, municipalities and regional districts are blaming water restrictions on Climate Change and crafting PR campaigns like Living The New Normal. To be fair, those local governments are besieged with population growth spurred on by ever increasing levels of immigration pushed by the feds. They are also now being dictated mandatory housing increases by the provincial government, without receiving the necessary monies to expand core services like potable water. Grant-seeking organizations such as B.C. Watershed Security Coalition are quick to support the drought myth for their own benefit, while careless reporters continue to trot out baseless eco-propaganda to be absorbed by a pretty-much-brainwashed public.
0 Comments
Leave a Reply. |
Hot Topics
Aboriginal Title Almost Record Heat Atmospheric Rivers Attribution Simulation Carbon Capture Child Litigation Climate Shift Index CO2 Offset Leakage Coastal Flood Risk Democracy Lost Drought Exaggeration Eco-Negativity Eco-Politics ESC Investment Evolution Excess Hydro Expert Hypocrisy Extreme Heatwaves Fake Hype Geo-Engineering Government Bias Heat Waves Hottest Month Ever Hottest Year Ever Housing Crisis Hyperthermia Ice Roads Indigenous Conservation Indoctrination Kelp Farms Landslides Media Bias Mental Illness Misplaced Reconcilliation Misleading Data National Discord Natural Gas Net-Zero Future Outside Play Park Take-Over Political Deception Public Safety Impasse Sea Level Ruse Socialist Agenda Solar Panels Species Not At Risk Statistical Dishonesty Sue Big Oil Temperature Trickery Treaty Infringment Tsunami Refuge Unmarked Burials Unprecedented Drought Urban Heat Island Very Hot Days Warming Causes Cold Water Supply White Dislike Wildfire Wildlife Death Woke Plans Worsening Storms |