|
Environment and Climate Change Canada (ECCC) recently released it’s pilot version of something called the Rapid Extreme Weather Event Attribution. This was picked up by CTV News who ran the story, Human-caused climate change made this summer's heat waves 2-10 times more likely: ECCC. CTV included a graphic to show how Western Canadian heatwaves this summer were significantly hotter than they would have been without human-caused climate change: 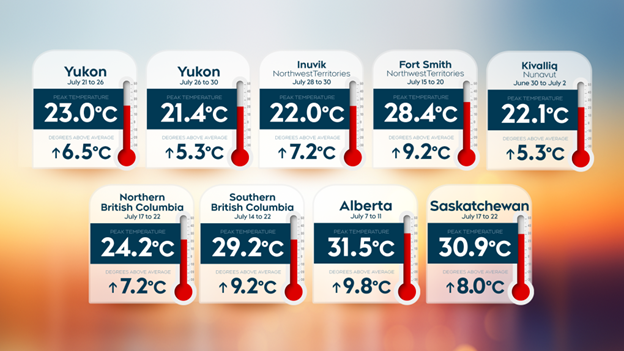 From this we are told that, in Southern British Columbia (a very diverse region that includes moderate coastal and hot interior summers), our peak heat this year topped-out at 29.2 C, which is also apparently 9.2 C warmer than it would have got to prior to 1850. The first question that arises is why would there be a 9.2 C difference in heatwaves when we are told that the world has warmed less than 1.5 C over the same period?
The next question would be how did ECCC come up with those temperature peaks? While the 9.2 C difference isn’t explained, how ECCC came up with it is: How it works: comparing two different climates The Rapid Extreme Weather Event Attribution pilot system uses climate models to represent two different climates:
So, peak heatwave temperatures in the 1800s are derived from the level of atmospheric gases (primarily CO2) that they believe existed back then, although there were no measurements taken. While present-day peak heatwave temperatures are derived from actual measured levels of greenhouse gases. This all takes place in a computer program that may or may not be fed actual temperature records (ECCC doesn’t say). If you are hoping for additional clarification from ECCC’s Footnote2, you will find it to be of no value whatsoever. If anything the study cited, The 2021 heatwave was less rare in Western Canada than previously thought, Weather and Climate Extremes, Volume 43, 2024, refutes the popular suggestion that today’s extreme heat events would be next to impossible without human-caused climate change. Having just gone through the July 14 to 22 “heatwave”, it didn’t seem like much in Vancouver. While the ECCC region in question is all of Southern British Columbia, the focus surely pertains to the coast because all interior regions would always experience peak temperatures much higher than the 29.2 C that the computer came up with. At Vancouver Airport (YVR), between July 14 and 22, 2024, actual maximum temperatures ranged between 22.5 C and 28.1 C, with an average maximum of 25.1 C for the 9 day event. Now, moving into the 2nd half of August, it is clear that this was the warmest period we will experience this summer. The records at YVR go back to 1937 and looking at the warmest 9 days for each year, there is a range of average daily maximums from 21.6 C to 29.0 C. The median is 25.3 C, so the 2024 period in question (25.1 C avg. max.) was cooler than the 88 year median. The top ten 9-day-heatwave years were: 1. 2009 – 29.0 C (avg. max.) 2. 1990 – 27.7 C 3. 2021 – 27.5 C 4. 1967 – 27.2 C 5. 1977 – 27.1 C 6. 1998 – 26.9 C 6. 2022 – 26.9 C 8. 1965 – 26.7 C 9. 2004 – 26.6 C 10. 1958 – 26.5 C With respect to peak temperatures recorded during the heatwaves: 1. 2009 – 34.4 C 2. 1960 – 33.3 C 3. 2021 – 32.4 C 4. 1990 – 31.9 C 4. 1998 – 31.9 C 6. 1961 – 31.7 C 7. 1988 – 31.5 C 8. 1942 – 30.6 C 8. 1970 – 30.6 C 10. 1977 – 30.5 C The 88 year range of peak temperatures was between 24.4 C and 34.4 C. The median is therefore 29.4 C, compared with the lower computer-generated 29.2 C peak temperature and the 28.1 C maximum temperature recorded this summer at YVR. In 53 of the 88 years, YVR experienced hotter peak temperatures than the “heatwave” of 2024. Some notable years with hotter peak temperatures were 1938, 1939, 1940, 1941, 1942, 1944 and 1946 – 7 of the first 10 years in the YVR record reached a hotter peak temperature than 2024. Despite this, ECCC’s Rapid Extreme Weather Event Attribution model states: Southern British Columbia:
You might expect this sort of chicanery from a climate activist group, not a once-respected government service. We used to rely on Environment Canada for scientific, verifiable, information. However, since it’s been renamed Environment and Climate Change Canada, it is now primarily a propaganda tool to justinfy the carbon tax, and massive spending on unnecessary enviro-programs.
0 Comments
Leave a Reply. |

Hot Topics
Aboriginal Title Almost Record Heat Atmospheric Rivers Attribution Simulation Carbon Capture Child Litigation Climate Shift Index CO2 Offset Leakage Coastal Flood Risk Democracy Lost Drought Exaggeration Eco-Negativity Eco-Politics ESC Investment Evolution Excess Hydro Expert Hypocrisy Extreme Heatwaves Fake Hype Geo-Engineering Government Bias Heat Waves Hottest Month Ever Hottest Year Ever Housing Crisis Hyperthermia Ice Roads Indigenous Conservation Indoctrination Kelp Farms Landslides Media Bias Mental Illness Misplaced Reconcilliation Misleading Data National Discord Natural Gas Net-Zero Future Outside Play Park Take-Over Political Deception Public Safety Impasse Sea Level Ruse Socialist Agenda Solar Panels Species Not At Risk Statistical Dishonesty Sue Big Oil Temperature Trickery Treaty Infringment Tsunami Refuge Unmarked Burials Unprecedented Drought Urban Heat Island Very Hot Days Warming Causes Cold Water Supply White Dislike Wildfire Wildlife Death Woke Plans Worsening Storms |